How to Track Form and Survey Analytics in GoHighLevel
Updated February 25, 2025
Without clear analytics, agencies have no way to identify where prospects abandon forms or which surveys drive the most engagement. This guide walks you through every metric available in GoHighLevel's form and survey analytics dashboard, from total views and completion rates to drop-off analysis and custom date filtering.
Advanced Form & Survey Analytics featuring robust filters, improved metrics, and innovative tools for deeper insights into form and survey performance.
- Total Views Analytics: Track total form and survey views with filters for specific forms/surveys or aggregated data for all forms/surveys. Time frames include the last 7, 14, 30, 60, 90 days, and custom date ranges.
- Total Response Analytics: Get insights into total responses with the same flexible filtering and time frames as views analytics.
- Completion Rate: Monitor completion rates, filtered by individual forms/surveys or all forms, across the same time periods and custom ranges.
- Average Time Analytics: Analyze the average time taken to complete forms and surveys with similar filters and time options.
- Graph Visualization: View your form and survey data visually through graphs, combined with a detailed list of forms for better context.
- Survey Drop-off Analysis: Track drop-off rates for survey slides to see where users disengage.
- Enhanced Pagination: Enhanced pagination for seamless navigation across views, responses, average time, and completion rates, featuring next/previous buttons and numbered pages.
Where you’ll find analytics for forms and surveys
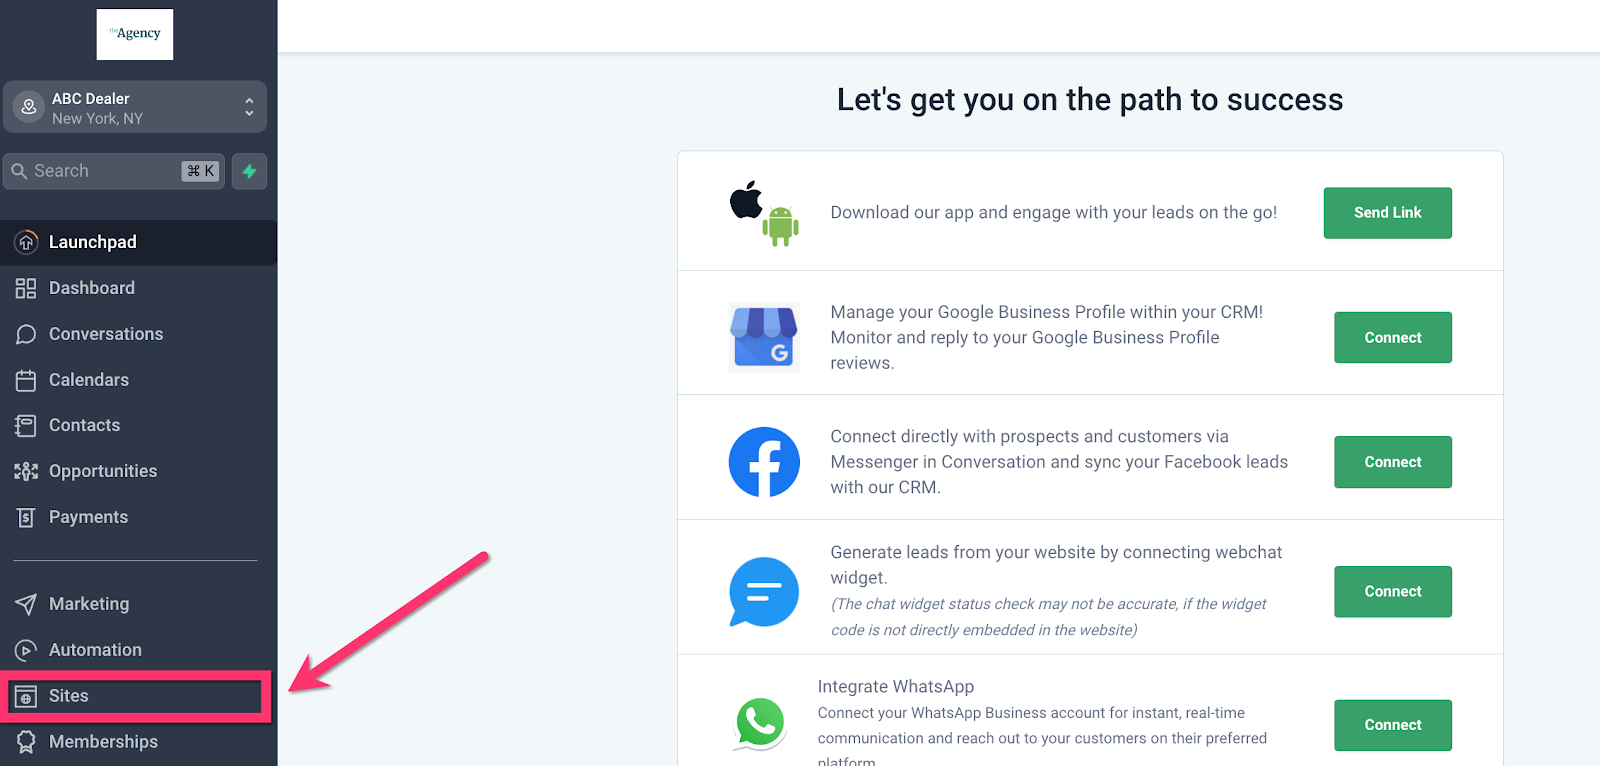
Step 1: Select Sites on the side menu in your dashboard
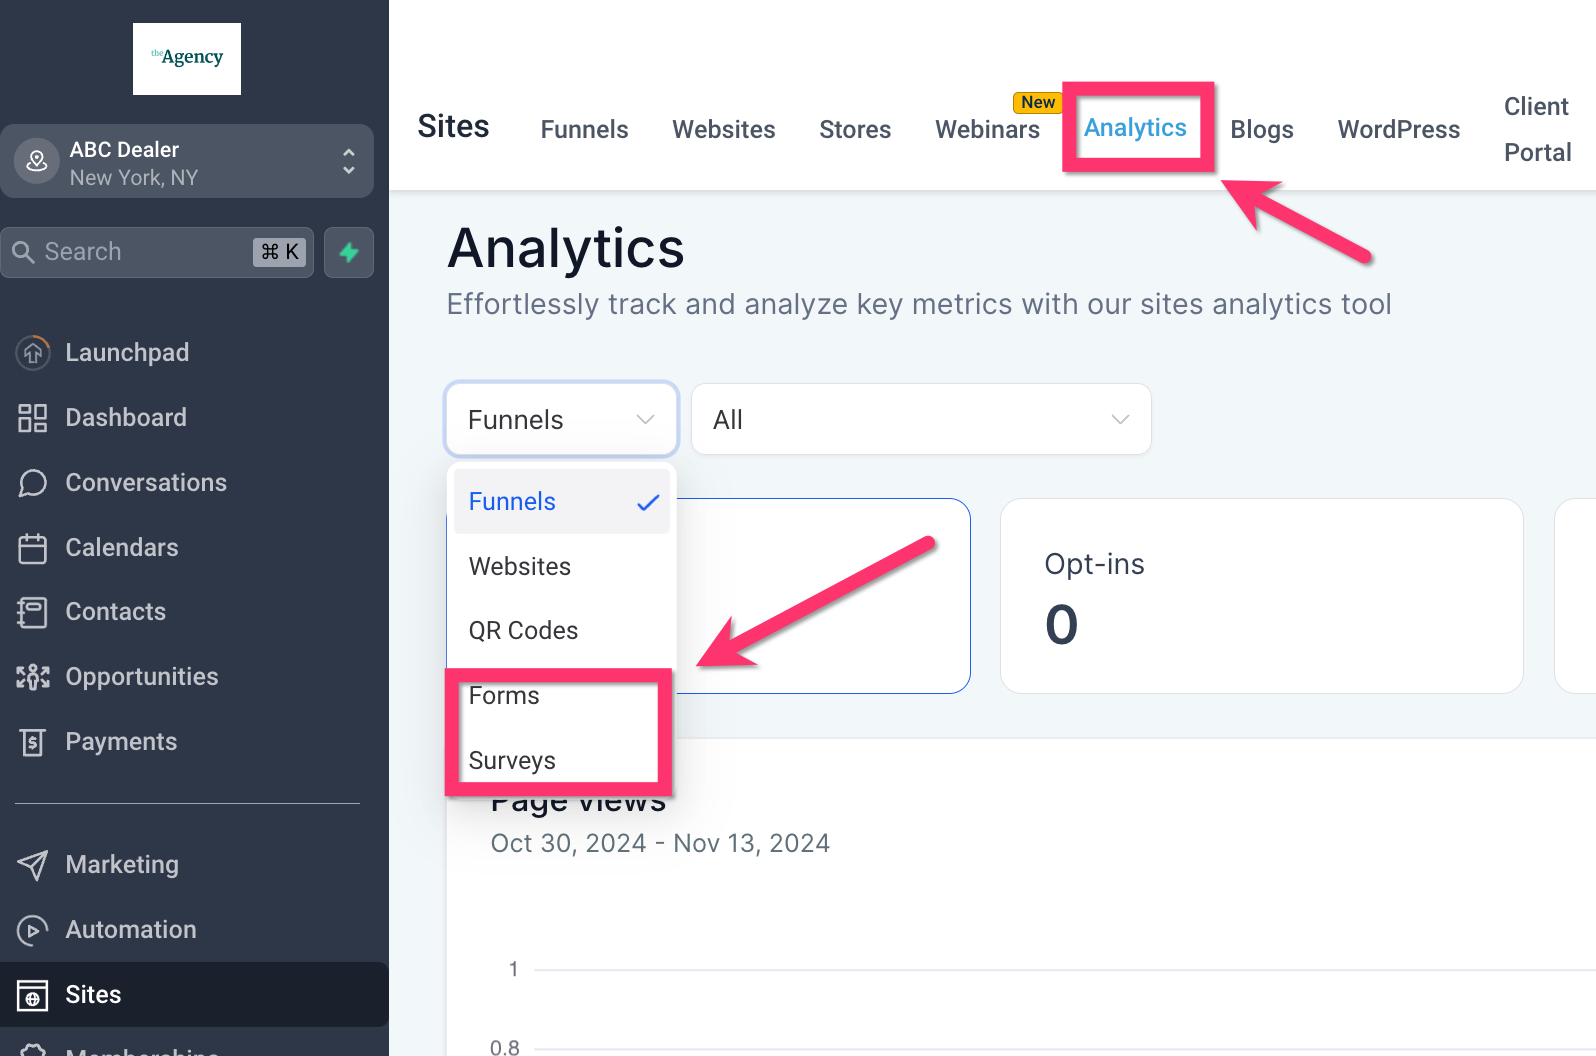
Step 2: Select Analytics from the top sub-menu and then select Forms or Surveys from the analytics type dropdown
Keep learning